Why is Frequency Domain Analysis Better Than Time Domain Analysis

Frequency domain analysis is better and preferred than time domain analysis because of some characteristics possessed by signals in frequency domain and that would be discussed below.
First what is time domain signal and frequency domain signal.
What is Time domain signal?
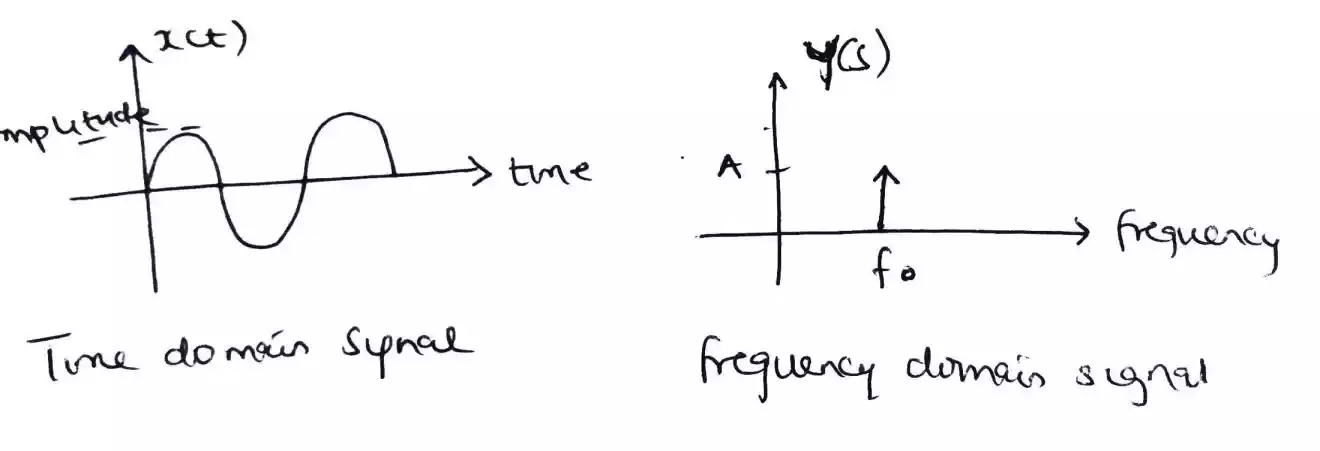
Signals in time domain is a signal plotted with the amplitude on the vertical or y axis with respect to time on the horizontal axis or X-axis.
Signals in time domain are measured in seconds or s.
What is Frequency domain signal?
Signals in frequency domain is a signal plotted with the amplitude on the vertical or y axis with respect to frequency on the horizontal axis or X-axis.
Signals in frequency domain are measured in Hertz of Hz
Why is frequency domain analysis better than time domain analysis?
-
Representation of signals
Using the signal shown below in time domain, which consist of two signals at different frequency mixed together e.g. human voice because it has a high and low tone.
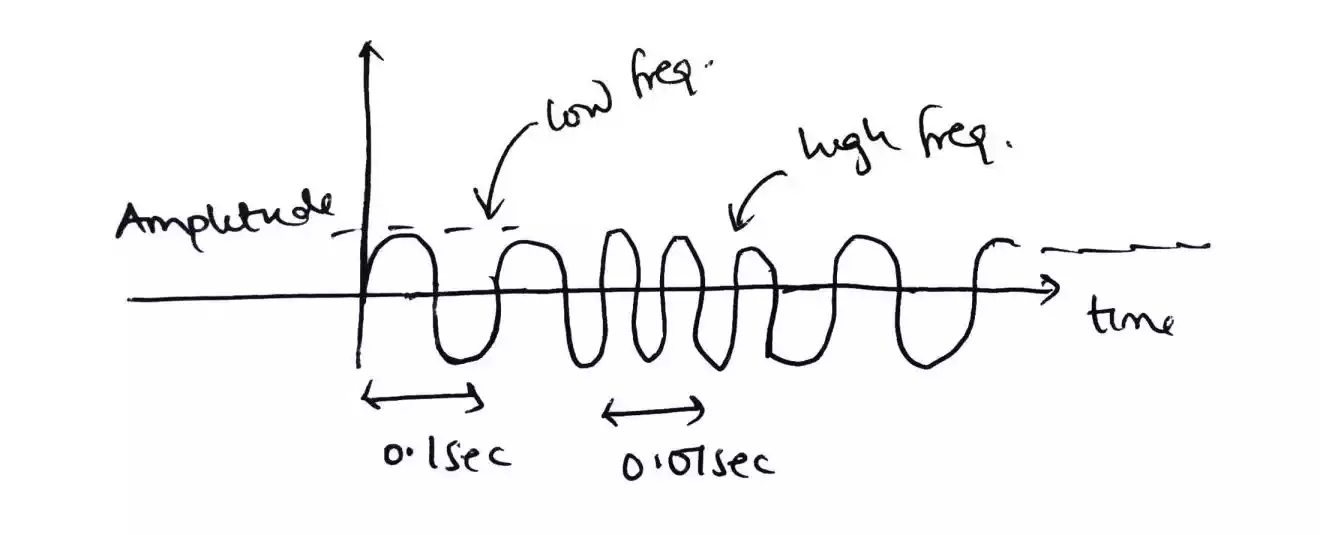
The signal can be represented in frequency domain with less complexity.
-
For the lower frequency signal, the time period is assumed to be 0.1 sec which results in a frequency f, of f = 1/T(time period) = 1/0.1sec = 10Hz.
-
For the higher frequency signal, the time period is also assumed to be 0.01 sec which results in a frequency, f = 1 / 0.01 sec = 100Hz.
In order to represent these two signals in frequency domain, the amplitude and the frequency is all that is needed.
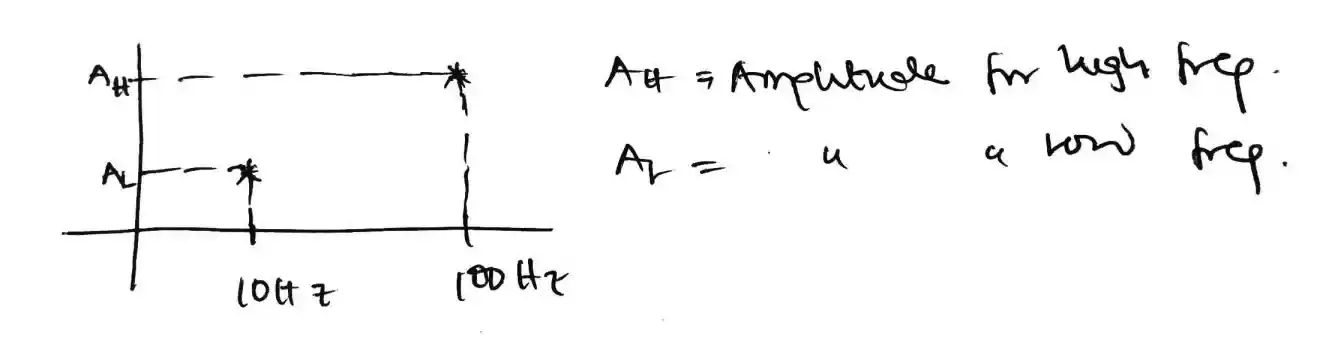
And as you can see the representation is less complicated and more understandable in frequency domain than the time domain.
-
-
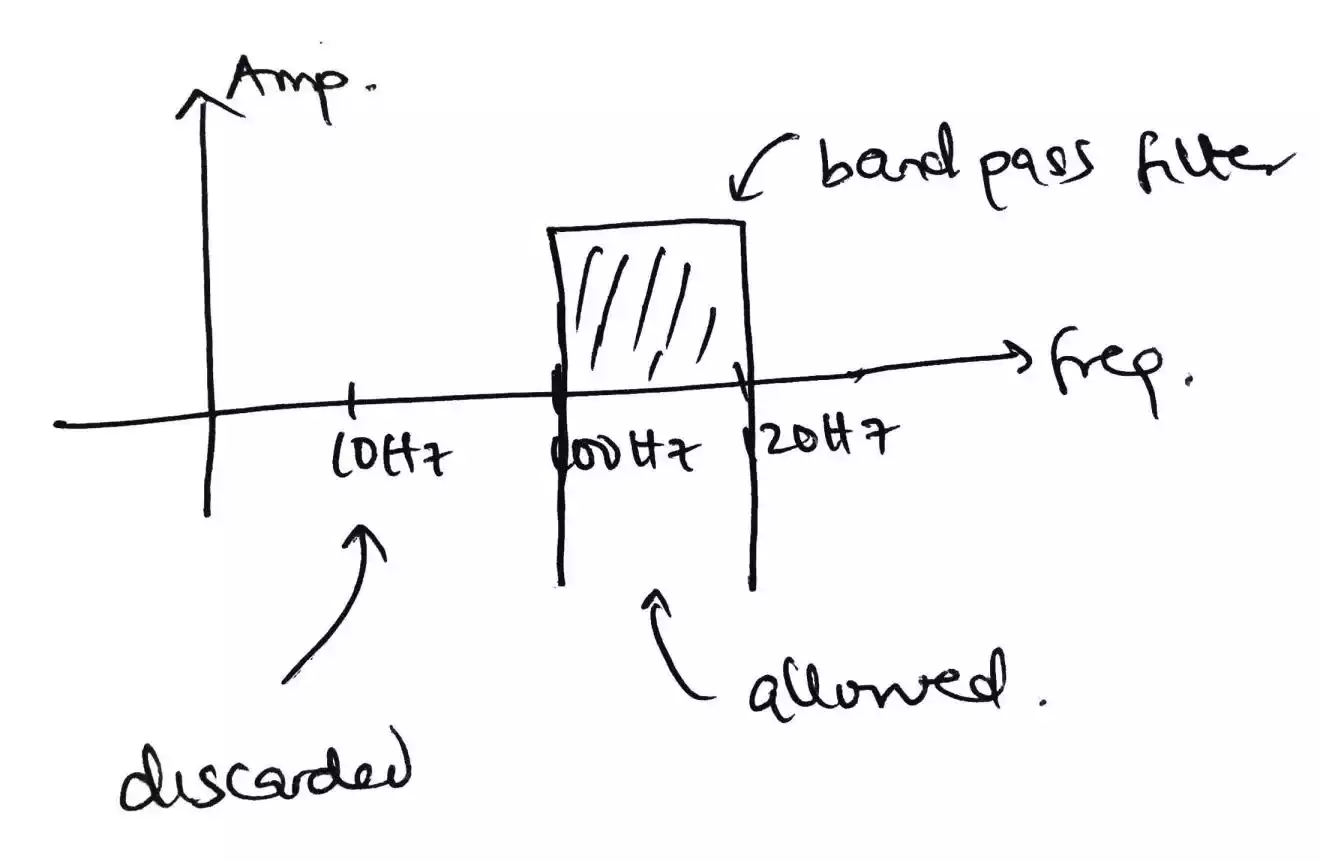
Filtering of signals
Due to the less complexity of the representation of signal in frequency domain, filters can be used to filter unwanted signal or to band pass some signals at certain frequency to pass.
In this case, a band pass signal that only allows signals between 100Hz and 120Hz is allowed while other signals not within this frequency range would be discarded.
The output would be –
-
Stability of a system
Another reason why frequency domain analysis is preferred over time domain analysis is that it allows the stability of a system to be known.
For example, the transfer function of a signal in time domain to Laplace or frequency domain can be represented as
H(s) = (s +1)/ (s + 2) (s + 3); The plot of the signal would be –
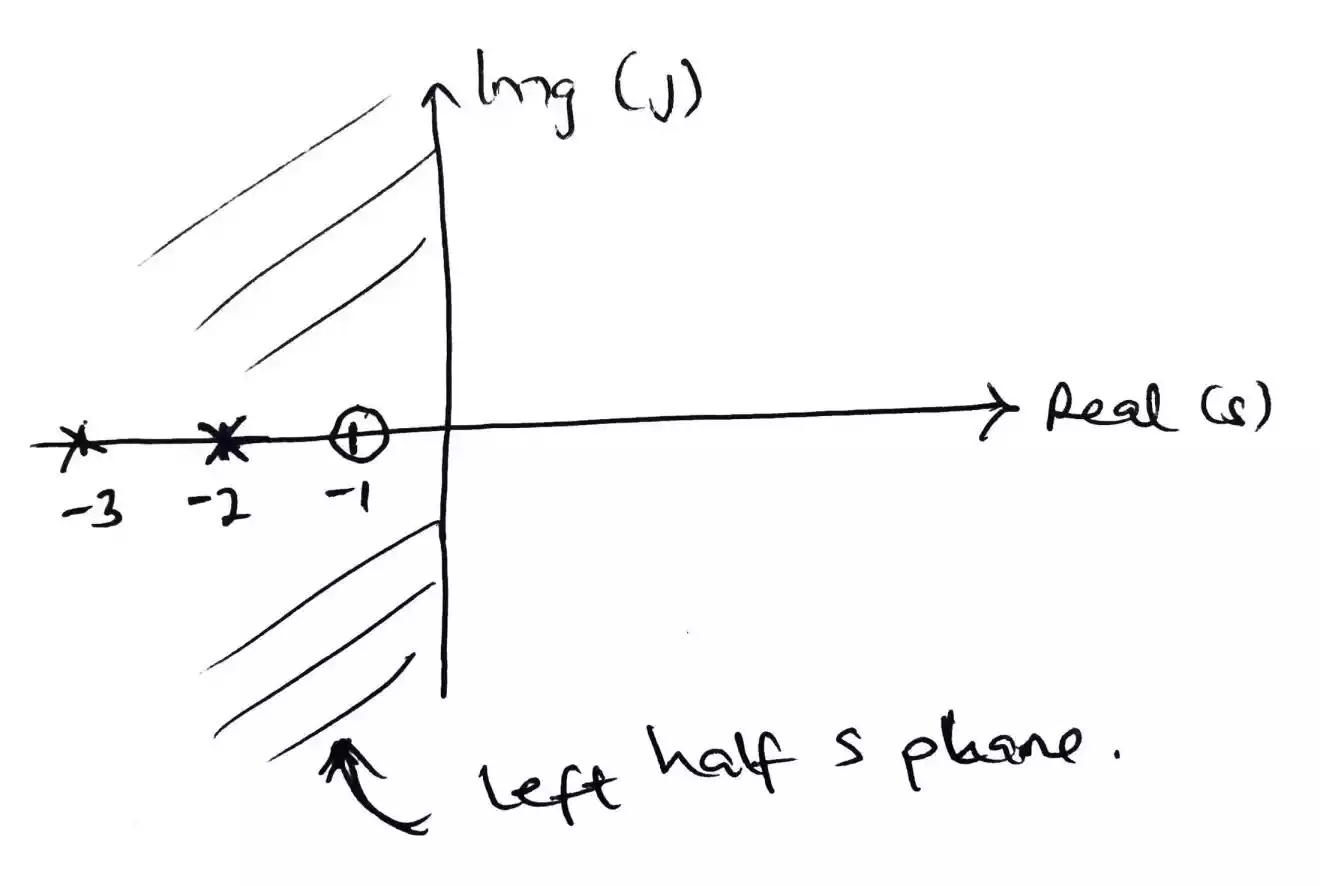
The two main parameters that are plotted from the response function is the poles and zeros.
The zero can be determined from the (s + 1) at the top by finding the value for s that will make (s + 1) to go to zero and it is s = -1. So (-1 + 1) equates to zero.
The poles (s + 2) (s + 3) have a s value at s = -2 and s = -3 to form poles. So (-2 + 2) and (-3 + 3) equates to zero.
The zero is denoted with O on the plot while the poles are denoted with X. Since all the roots are on the left half of the s-plane it is considered that the system is stability.
-
Convolution of different signals
When there are two signals in time domain that needs to be mixed, then they are convoluted using convolution.
But in the case of frequency domain, signals need not be convoluted rather they just need to be multiplied directly.
x(t) * y(t) —- convolution of signals in time domain X(F) . Y(F) —- multiplication of signals in frequency domain